Skip to content
SunGeneAgricultural IoT
← All products
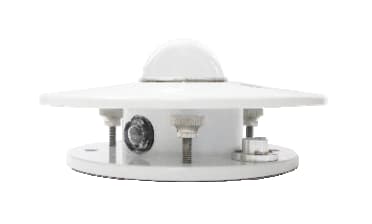
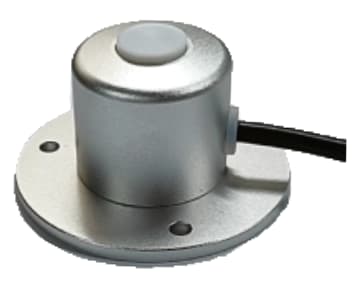
SG-SRD-113: PAR (Photosynthetically Active Radiation) Quantum Sensor

Pictured: SG-SRD-113 — PAR (Photosynthetically Active Radiation) Quantum Sensor.

PAR Quantum Sensor

Equipment options & specifications

Compare light at crop height in greenhouses, nurseries and growing areas. Use a PAR quantum sensor for plant-light photon flux density; choose a pyranometer when you need broadband solar irradiance in W/m².

Related application hardware: Soil & weather monitoring

Plant light or solar radiation: which measurement do you need?

Choose the quantity you need to record before choosing the output. PAR photon flux density and broadband irradiance in W/m² are different measurements.

Compare the light reaching plants

Use PAR measurements to compare shaded and exposed growing positions, or to record changes when supplemental lighting is switched on. Mount the sensor near a representative growing position.

  1. PAR quantum sensor at the growing position
  2. Selected output and matching logger input
  3. Plant-light photon-flux record
Record broadband solar radiation

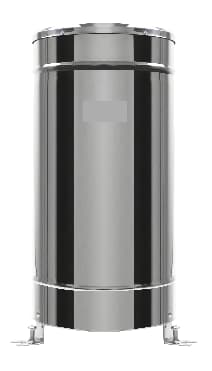
If your weather record calls for solar irradiance in W/m², compare the pyranometer instead. Choose its output for the receiving equipment; a PAR reading measures a different quantity.

  1. Broadband solar-radiation requirement
  2. Pyranometer and matching receiving input
  3. Solar-irradiance record in W/m²

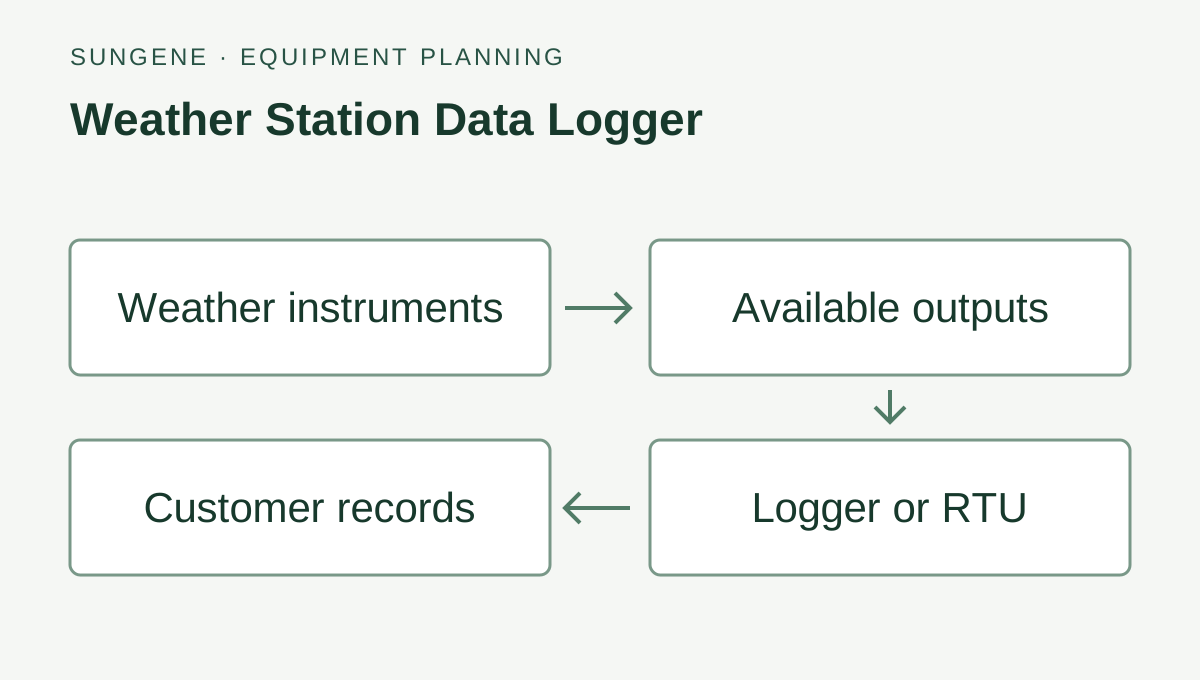
Example measurement and data paths. Confirm the selected interfaces, power and receiving equipment for your installation.

Before choosing the configuration

  • Match the output and supply

    Select the PAR output for your logger: millivolt, two-wire 4–20 mA or RS485. The supply must match the ordered output; these are alternative configurations.

  • Keep the measurement position useful

    Mount the sensing surface horizontally, keep its optical path clear and its surface clean. Confirm the calibration coefficient and input scaling before recording readings.

  • Send the logger details with your request

    Tell us the crop or growing environment, required measurement, logger input or protocol, available supply, cable route and quantity. A logger label or input specification helps identify the matching configuration.

Send your sensor or logger details, site power, quantity and destination country. Include an equipment label or connection specification if you are adding to an existing installation.

Request a PAR sensor quotation

Compare equipment for the rest of your station

Select each measurement and check its interface with the receiving equipment. These product families are quoted separately.

Plan a weather and soil monitoring station

Greenhouse and nursery light measurement

From a PAR reading to daily light integral

PPFD describes the light arriving at crop height now. Daily light integral (DLI) adds the light received over a day. Record both to compare growing positions and changes in shade or supplemental lighting.

One reading: PPFD

Light intensity at one moment.

Daily accumulation: DLI

Readings multiplied by elapsed time.

Measurement illustration. The shaded area represents accumulated light; the curves are illustrative.

DLI = mean PPFD × light hours × 0.0036. A noon sunlight reading is not a daily average. Keep sensor position, timestamps and missing readings in the light record. The crop team sets lighting targets and schedules.

PAR sensor

Select the output and matching supply for the instrument.

Compatible logger

Match the electrical input, calibration and recording interval.

Daily light record

Agree daily accumulation, time zone and data delivery in the receiving system.

Where this equipment fits

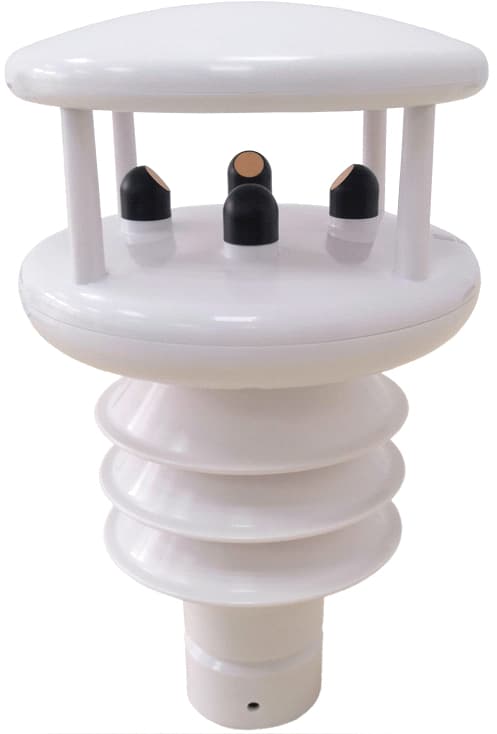
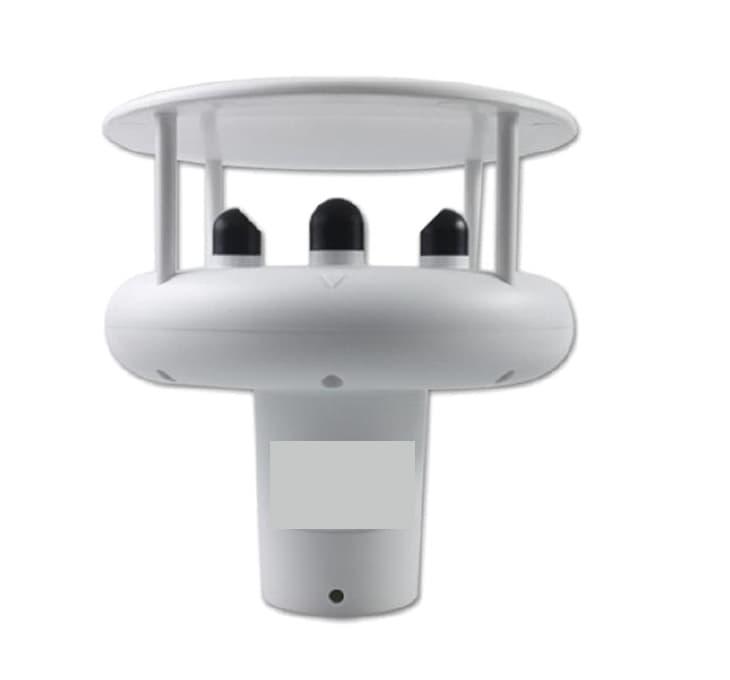
SG-WS-162: Ultrasonic All-in-One Automatic Weather Station
Pictured: SG-WS-162 — Ultrasonic All-in-One Automatic Weather Station.

Check plant light under greenhouse shading

Place the PAR sensor near a representative growing position and compare photon flux density in shaded and exposed areas. Use the readings to follow available plant light; choose the sensor output and logger input together.

Compare nursery light with supplemental lighting on and off

Record PAR readings where the plants are growing before and after the lights are switched on. Keep the sensor level and its surface clean, and use the calibration coefficient and input scaling for the selected configuration.

Specifications & version options

SG device code
SG-SRD-113
PAR spectral band
400–700 nm for the PAR configuration
PAR measuring range
0–2,500 µmol/m²/s for the PAR configuration
Output options
0–2,000 mV, 4–20 mA two-wire or RS485; select the matching configuration
Supply options
5 VDC or 12–24 VDC, matched to the selected output
Housing
Aluminium alloy
Show 1 more specification row

Equipment quotation

The quotation lists the selected equipment, accessories, price and delivery terms.

Purchasing and delivery details →

Documents and downloads

Selection guidance and application documents. Wiring, register maps and certificates must match the chosen model and version.

Open family selection sheet

English · Web page · printable
Online selection guide

Read equipment selection guide

Weather-station equipment selection guide
Web page · printable · English

Model-specific documents

Tell us which wiring, protocol or calibration documents you need for the equipment.

On this page
Application guide and product-family selection sheet
For your configuration
  • Exact-model datasheet
  • Wiring / pinout
  • Register map, protocol or sample data
  • Model-specific certificates
  • Calibration and measurement evidence
  • Dimensions / installation drawing
Project starter files →
Request an engineering package →
From a product family to your order
  1. Family page

    Compare uses, interfaces and configuration options. These are selection references.

  2. Equipment configuration

    Define the required function, interfaces, power, mounting and accessories for the site.

  3. Written quotation

    Confirm the exact model, configuration, photograph, document revisions, accessories, price, delivery and warranty.

Get selection help

Tell us what you want to measure and where. Send a model number or site photo if you have one.

Text stays in this tab for up to 30 minutes while you browse. Saving across reloads is optional below.

A personal email is welcome.

A country and general site description are enough. If the location is undecided, say so.

Photos, model information or BOM (optional)

Up to 5 files, 10 MB each. PDF, JPG, PNG, WebP, CSV, TXT, DOCX or XLSX.

By submitting this form, you acknowledge the privacy notice.

See where the system fits

Equipment in the system

Example equipment arrangement. Check compatibility and agree who handles software, PLC/SCADA programming and site installation.

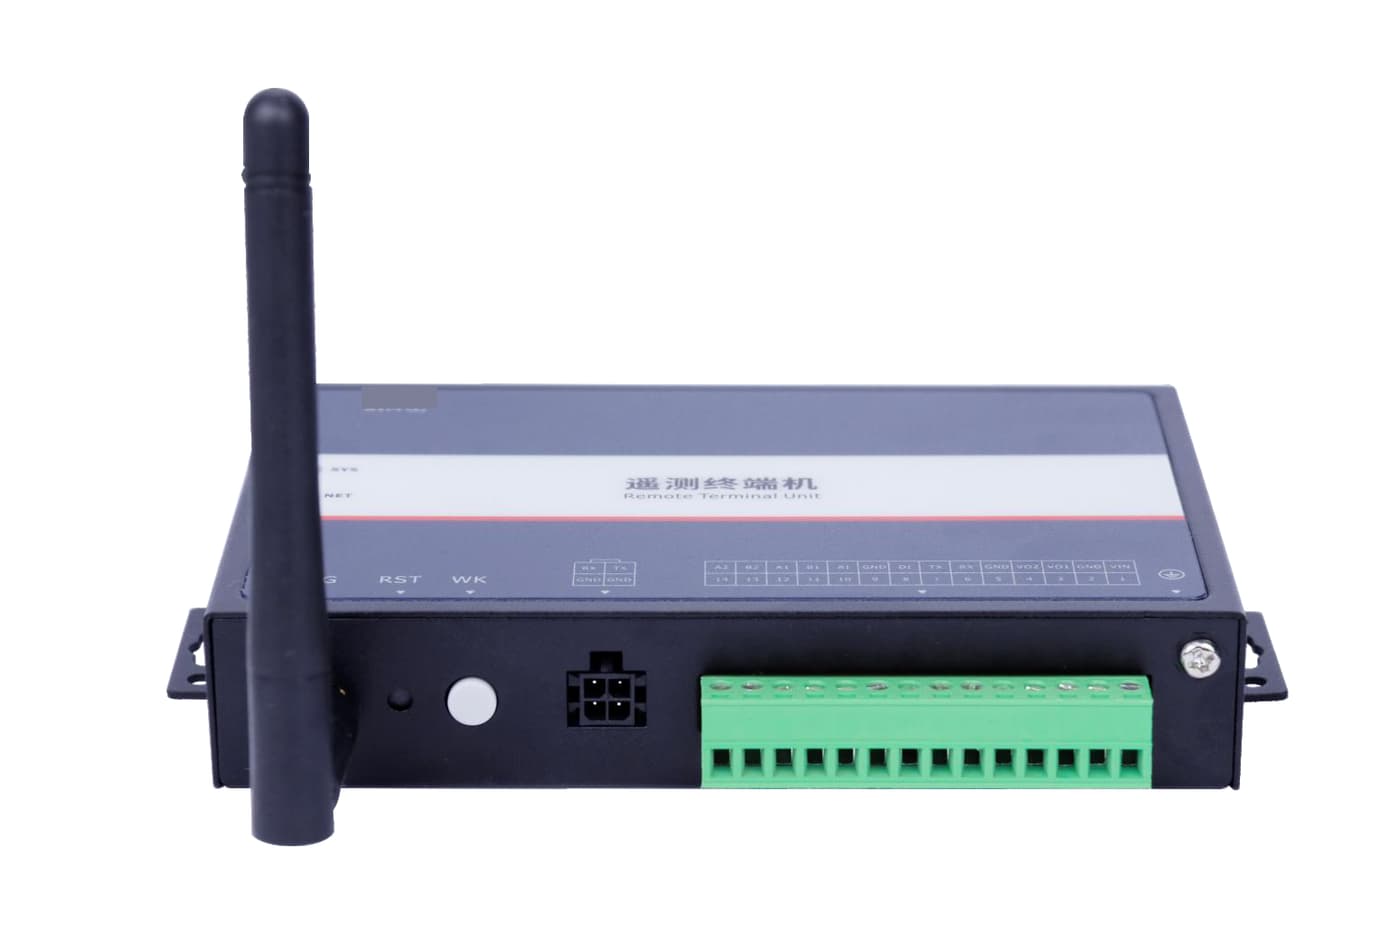
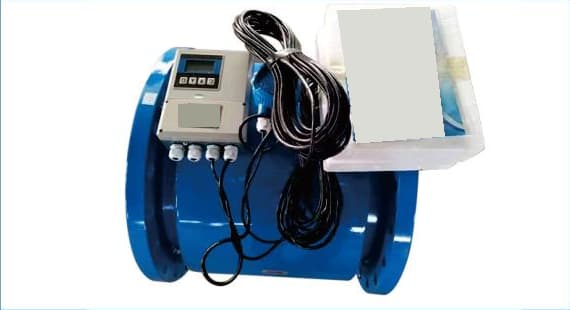
SG-RTU-145: Water Level Telemetry Terminal

Product photograph

Pictured: SG-RTU-145 — Water Level Telemetry Terminal.

Installation and selection

  • Mount the sensing surface horizontally and keep its optical path clear.
  • Use the PAR configuration when reporting photon flux density. A broadband W/m² radiation configuration measures a different quantity.
  • Confirm calibration coefficient, cable, input scaling and chosen output before connecting a logger.

Continue product selection

Compare related equipment and connection options.

Compatible with

  • A receiving logger or controller with the selected electrical input and documented protocol
  • The agreed customer platform through a compatible logger or gateway

Typical package

  • Selected device, cable and mounting configuration as listed in the quotation
  • External sensors, power equipment and communications are listed separately where required

Applications

Select the sensor set, mast, solar supply, enclosure and probe positions for the crop and site.

Measure light available to crops and greenhouse plants with a calibrated quantum sensor.

  • Greenhouse light monitoring and supplemental-light scheduling
  • Crop-growth and agrometeorological measurements
  • Ecological research and environmental monitoring
See related application hardware

Related selection guides

Related resources

Frequently asked questions

What does this sensor measure for a greenhouse?

The PAR configuration measures photon flux density in the 400–700 nm band. Place it near a representative growing position to compare available plant light. A broadband radiation reading in W/m² is a different measurement.

Which output should I choose for my logger?

Choose the PAR sensor output that matches the logger input: 0–2,000 mV, two-wire 4–20 mA or RS485. Confirm the matching supply, calibration coefficient, cable and input scaling before ordering.

How do I calculate daily light integral from PPFD?

For a constant or time-averaged PPFD in µmol/m²/s, multiply by hours of light per day and 0.0036 to estimate DLI in mol/m²/day. This assumes zero PAR outside that period. For changing sunlight, integrate repeated, timestamped readings through the day.

Does a PAR sensor calculate DLI or control greenhouse lights?

The sensor provides a light measurement through its selected output. A compatible logger or receiving system collects the readings and performs the agreed daily accumulation. Lighting commands, crop targets and controller integration are separate project functions.

Will it work with my existing system?

Use the listed inputs, power and protocol to match the device to your controller. Send its model or an input photo with the equipment request.